参照したページ
Chart.js 公式ドキュメント
- latestバージョンのドキュメント: Chart.js | Chart.js
- 4.4.0のドキュメント: Chart.js | Chart.js
jsDelivr
pluginの作り方
- Plugins | Chart.js
- Chart.js 2 の積み上げ棒グラフに合計値を表示するプラグインを作成 / Twin Turbo Computing
- https://noarts.net/archives/843
網羅的にまとめてあるページ
X軸のラベルを縦書きにするQiita記事
v2からv3になってX軸とY軸のオプションのオブジェクト構造が変更されていたことについてのQiita記事
はじめに
npmとか使わずに静的なhtmlにチャートを表示する必要に迫られて色々と調べました。
チャートのオプションは巨大なオブジェクトで、英語が読めないせいもあり、プロパティの意味がわからない場合が多くていつも辛い。
TypeScriptだったら楽かも。
基本的に Chart.js 4.4.0 の設定値について書いています。
バージョンによってプロパティ名やオブジェクト構造が違うので注意が必要です。
とりあえず棒グラフの例だけ書いていますが、後日他のチャートタイプについても書くかもしれません。
ついでに積み上げ棒グラフ(Stacked Bar Chart)の合計値を表示するプラグインを作成しました。
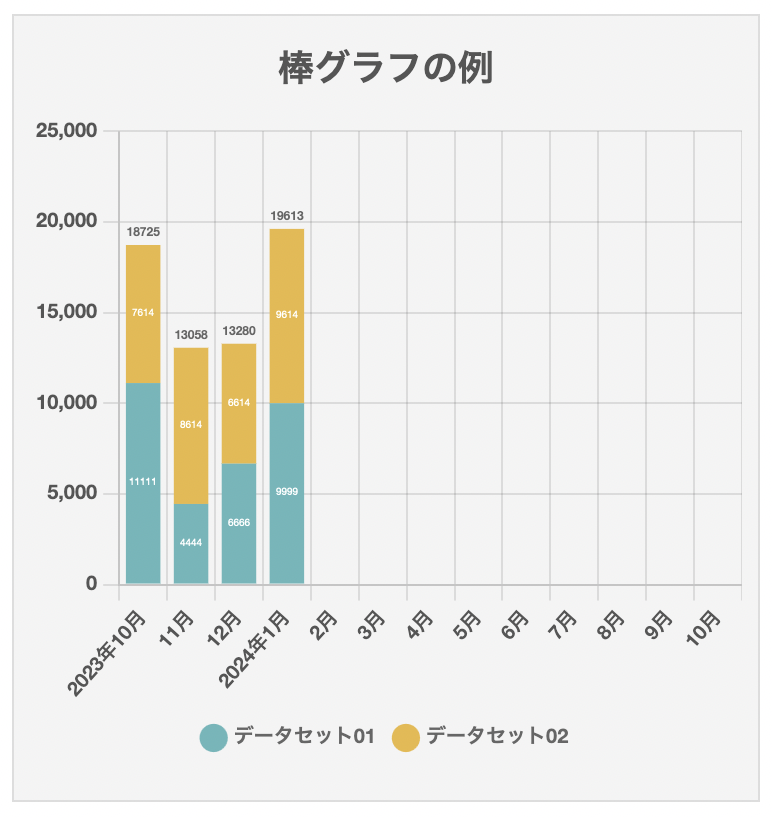
スクリーンショット
以下のような感じに表示されます。
PC

SP
公式ドキュメントに掲載されているオプションの例
最新バージョンの各チャートタイプのオプションの例は以下の公式ページで確認するとわかりやすかったです。
バージョンごとのオプションについては、ちょっと見難い感じもしますが以下のページなどで確認できます。
chart-js-examples.html の作成
まずhtmlファイルを作成します。
CSSも含めて以下の通り作成しました。
<html>
  <head>
    <style>
      .chart-wrapper {
        height: 360px;
        padding: 16px 8px;
        background-color: #f4f4f4;
        border: 1px solid #dddddd;
      }

      @media screen and (min-width: 992px) {
        .chart-wrapper {
            height: 680px;
        }
      }
    </style>
  </head>
  <body>
    <section class="chart-wrapper">
      <!-- タイトルの左にアイコン付けたいとかデザイン的な理由でここに( title )入れても良い -->
      <canvas id="bar-chart-example"></canvas>
    </section>

    <!-- cdn から chart.js を読み込む -->
    <script src="https://cdn.jsdelivr.net/npm/chart.js@4.4.0/dist/chart.umd.min.js"></script>
    <script src="https://cdn.jsdelivr.net/npm/chartjs-plugin-datalabels@2.2.0/dist/chartjs-plugin-datalabels.min.js"></script>

    <!-- 自作のプラグインを読み込む -->
    <script src="./chartjs-plugin-total-labels.js"></script>

    <!-- bar-chart-example.js -->
    <script src="./bar-chart-example.js"></script>
  </body>
</html>
Stacked Bar Chart の合計値を表示するプラグインの作成
chartjs-plugin-total-labels.js を以下の記述内容で作成しました。
const ChartTotalLabels = {
  /**
   * options.plugins.{plugin-id} のルールで使用されるid
   * 詳しくは https://www.chartjs.org/docs/4.4.0/developers/plugins.html#plugin-id を参照してください。
   */
  id: 'totalLabels',

  /**
   * 合計値ラベルを描画
   */
  afterDatasetsDraw: function (chart, _args, options) {
    const font = options.font();
    const fontSize = Number(font.size.replace('px', ''));

    ctx = chart.ctx;
    // ラベルの書式設定
    ctx = this.setTextStyle(ctx, fontSize);
    // 各棒最後の項目のメタ情報を取得
    const meta = this.getLastMeta(chart);
    // 各合計値を取得
    const sums = this.calcSums(chart);
    // ラベル描画
    const labels = this.makeLabels(meta, sums, fontSize);
    labels.forEach(function (label) {
      ctx.fillText(label.value, label.x, label.y);
    });
  },

  /**
   * 各項目の合計を取得
   */
  calcSums: function (chart) {
    const valueList = [];
    chart.data.datasets.forEach(function (dataset, i) {
      var meta = chart.getDatasetMeta(i);

      // 非表示の項目は処理しない
      if (meta.hidden) {
        return;
      }
      dataset.data.forEach(function (value, j) {
        if (typeof valueList[j] === 'undefined') {
          valueList[j] = { sum: 0, groupByIndex: [] };
        }

        valueList[j].groupByIndex.push(value);
        valueList[j].sum = valueList[j].sum + value;
      });
    });

    const sums = valueList.map(function(valueItem) {
      const isWillNull = valueItem.sum === 0
        && valueItem.groupByIndex.every(function(item) { return item === null });

      return isWillNull ? null : valueItem.sum;
    })

    return sums;
  },

  /**
   * 各棒最後の項目のメタ情報を取得
   * (非表示のものは除く)
   */
  getLastMeta: function (chart) {
    let i = chart.data.datasets.length - 1;
    let meta = undefined;
    do {
      meta = chart.getDatasetMeta(i);
      i--;
    } while (meta.hidden && i >= 0);

    return meta;
  },

  /**
   * ラベル情報を取得
   */
  makeLabels: function (meta, sums, fontSize) {
    const labels = [];
    sums.forEach(function (sum, i) {
      const labelX = meta.data[i].x;
      const labelY = meta.data[i].y;
      labels.push({
        value: sum === null ? '' : sum.toString(),
        x: labelX,
        y: labelY - fontSize,
      });
    });

    return labels;
  },

  /**
   * 書式設定
   */
  setTextStyle: function (ctx, fontSize) {
    const fontStyle = "bold";
    const fontFamily = "'Helvetica Neue', Helvetica, Arial, sans-serif";
    ctx.font = Chart.helpers.fontString(fontSize, fontStyle, fontFamily);
    ctx.fillStyle = "#666";
    ctx.textAlign = "center";
    ctx.textBaseline = "middle";

    return ctx;
  }
};
棒グラフの例: ( bar-chart-example.js の作成 )
以下の通り記述しました。
(function () {
  // canvas要素を取得
  const ctx = document.getElementById('bar-chart-example');

  // ブレークポイント
  const BREAKPOINTS = {
    lg: 992,
  };

  // X軸のメモリラベル
  const DATA_LABELS = [
    ['10月', '2023年'], // 配列で渡すと改行される
    ['11月'],
    ['12月'],
    ['1月', '2024年'],
    ['2月'],
    ['3月'],
    ['4月'],
    ['5月'],
    ['6月'],
    ['7月'],
    ['8月'],
    ['9月'],
    ['10月'],
  ];

  // 関数
  function isWindowWidthLg() {
    return BREAKPOINTS.lg <= window.innerWidth;
  }

  // newする
  new Chart(ctx, {
    type: 'bar',
    data: {
      labels: DATA_LABELS,
      datasets: [
        {
          backgroundColor: '#64b7ba',
          label: 'データセット01',
          data: [
            11111,
            4444,
            6666,
            9999,
            null,
            null,
            null,
            null,
            null,
            null,
            null,
            null,
            null,
          ],
        },
        {
          backgroundColor: '#eab841',
          label: 'データセット02',
          data: [
            7614,
            8614,
            6614,
            9614,
            null,
            null,
            null,
            null,
            null,
            null,
            null,
            null,
            null,
          ],
        },
      ],
    },
    options: {
      maintainAspectRatio: false, // 縦横比を自動調整するかどうか
      onResize: function(chartInstance, size) {
        // chartInstanceとsizeを引数で受け取れる
        // sizeはcanvasのstyle属性のwidthとheightに設定された値で、ctx.widthとctx.heightはcanvasのwidth属性とheight属性に設定された値です。詳細はブラウザの開発ツールで確認してください。
        console.log('chartInstance: ', chartInstance);
        console.log('size: ', size);
        console.log('ctx: ', ctx.height);
        console.log('ctx: ', ctx.width);
        console.log('ctx: ', ctx.style);

        // chartInstanceの値を上書きすることでレスポンシブ対応できる
        // あらかじめ取得しておいたctxのstyle属性なども、試してないけどたぶんここで上書きできると思う
        // fontの設定値はここではなく、各fontにコールバックを渡す方が簡単そう
        if (isWindowWidthLg()) {
          // Window幅がlg以上の場合の設定
          chartInstance.data.labels = DATA_LABELS;
          return;
        }

        // Window幅がlg未満の場合の設定
        const dataLabelsForMd = DATA_LABELS.map(function(item){ return item.reverse().join('') });
        chartInstance.data.labels = dataLabelsForMd;
      },
      plugins: {
        // チャート上に表示される値 ( 各datasetごとに別々の色を設定することも可能 )
        datalabels: {
          color: '#ffffff',
          font: function() {
            if (isWindowWidthLg()) {
              return {
                size: '12px',
              };
            }

            // Window幅がlg未満の場合の設定
            return {
              size: '5px',
            };
          },
        },
        totalLabels: {
          font: function() {
            if (isWindowWidthLg()) {
              return {
                size: '14px',
              };
            }

            // Window幅がlg未満の場合の設定
            return {
              size: '6px',
            };
          },
        },
        // 凡例
        legend: {
          display: true,
          labels: {
            font: function() {
              if (isWindowWidthLg()) {
                return {
                  weight: 'bold',
                  size: '16px',
                };
              }

              // Window幅がlg未満の場合の設定
              return {
                weight: 'bold',
                size: '10px',
              };
            },
            usePointStyle: true,
            pointStyle: 'circle', // (usePointStyleと一緒に設定しないと効果ないので注意)
          },
          position: 'bottom',
        },
        // タイトル (タイトルはhtmlとcssで普通に描画してもよさそう)
        title: {
          color: '#555555',
          display: true,
          font: function() {
            if (isWindowWidthLg()) {
              return {
                weight: 'bold',
                size: '24px',
              };
            }

            // Window幅がlg未満の場合の設定
            return {
              weight: 'bold',
              size: '18px',
            };
          },
          padding: {
            bottom: 20,
          },
          text: '棒グラフの例',
        },
      },
      scales: {
        y: {
          stacked: true, // 縦に積む場合はtrue
          suggestedMax: 25000, // 目盛りの最大値を大きめに設定したい場合など ( 本当に固定したい場合は max というプロパティもある )
          ticks: {
            stepSize: 5000, // 目盛り間隔
            color: '#555555', // 目盛りラベルの色
            font: function() {
              if (isWindowWidthLg()) {
                return {
                  size: '16px',
                  weight: 'bold',
                }
              }

              return {
                size: '10px',
                weight: 'bold',
              }
            },
          },
        },
        x: {
          stacked: true, // 縦に積む場合はtrue
          ticks: {
            autoSkip: false, // canvasの幅が狭い場合に目盛りを省略するかどうか ( 目盛りを省略せずに角度をつけて重ならないようにする選択肢もある )
            color: '#555555', // 目盛りラベルの色
            font: function() {
              if (isWindowWidthLg()) {
                return {
                  size: '14px',
                  weight: 'bold',
                }
              }

              return {
                size: '10px',
                weight: 'bold',
              }
            },
            // maxRotation: 90, // canvasの幅が狭いときなどに角度をつけて重ならないようにする
            // minRotation: 90, // canvasの幅が狭いときなどに角度をつけて重ならないようにする
          },
        },
      },
    },
    // 各種プラグインを使用する場合は配列に入れる
    plugins: [
      ChartDataLabels,
      ChartTotalLabels,
    ],
  });
})();
General ( 深いところにある共通プロパティの設定 )
fontの設定
fontにはコールバック関数を渡すこともできるので、レスポンシブ対応に便利そうです。